
Monitoring and health checks
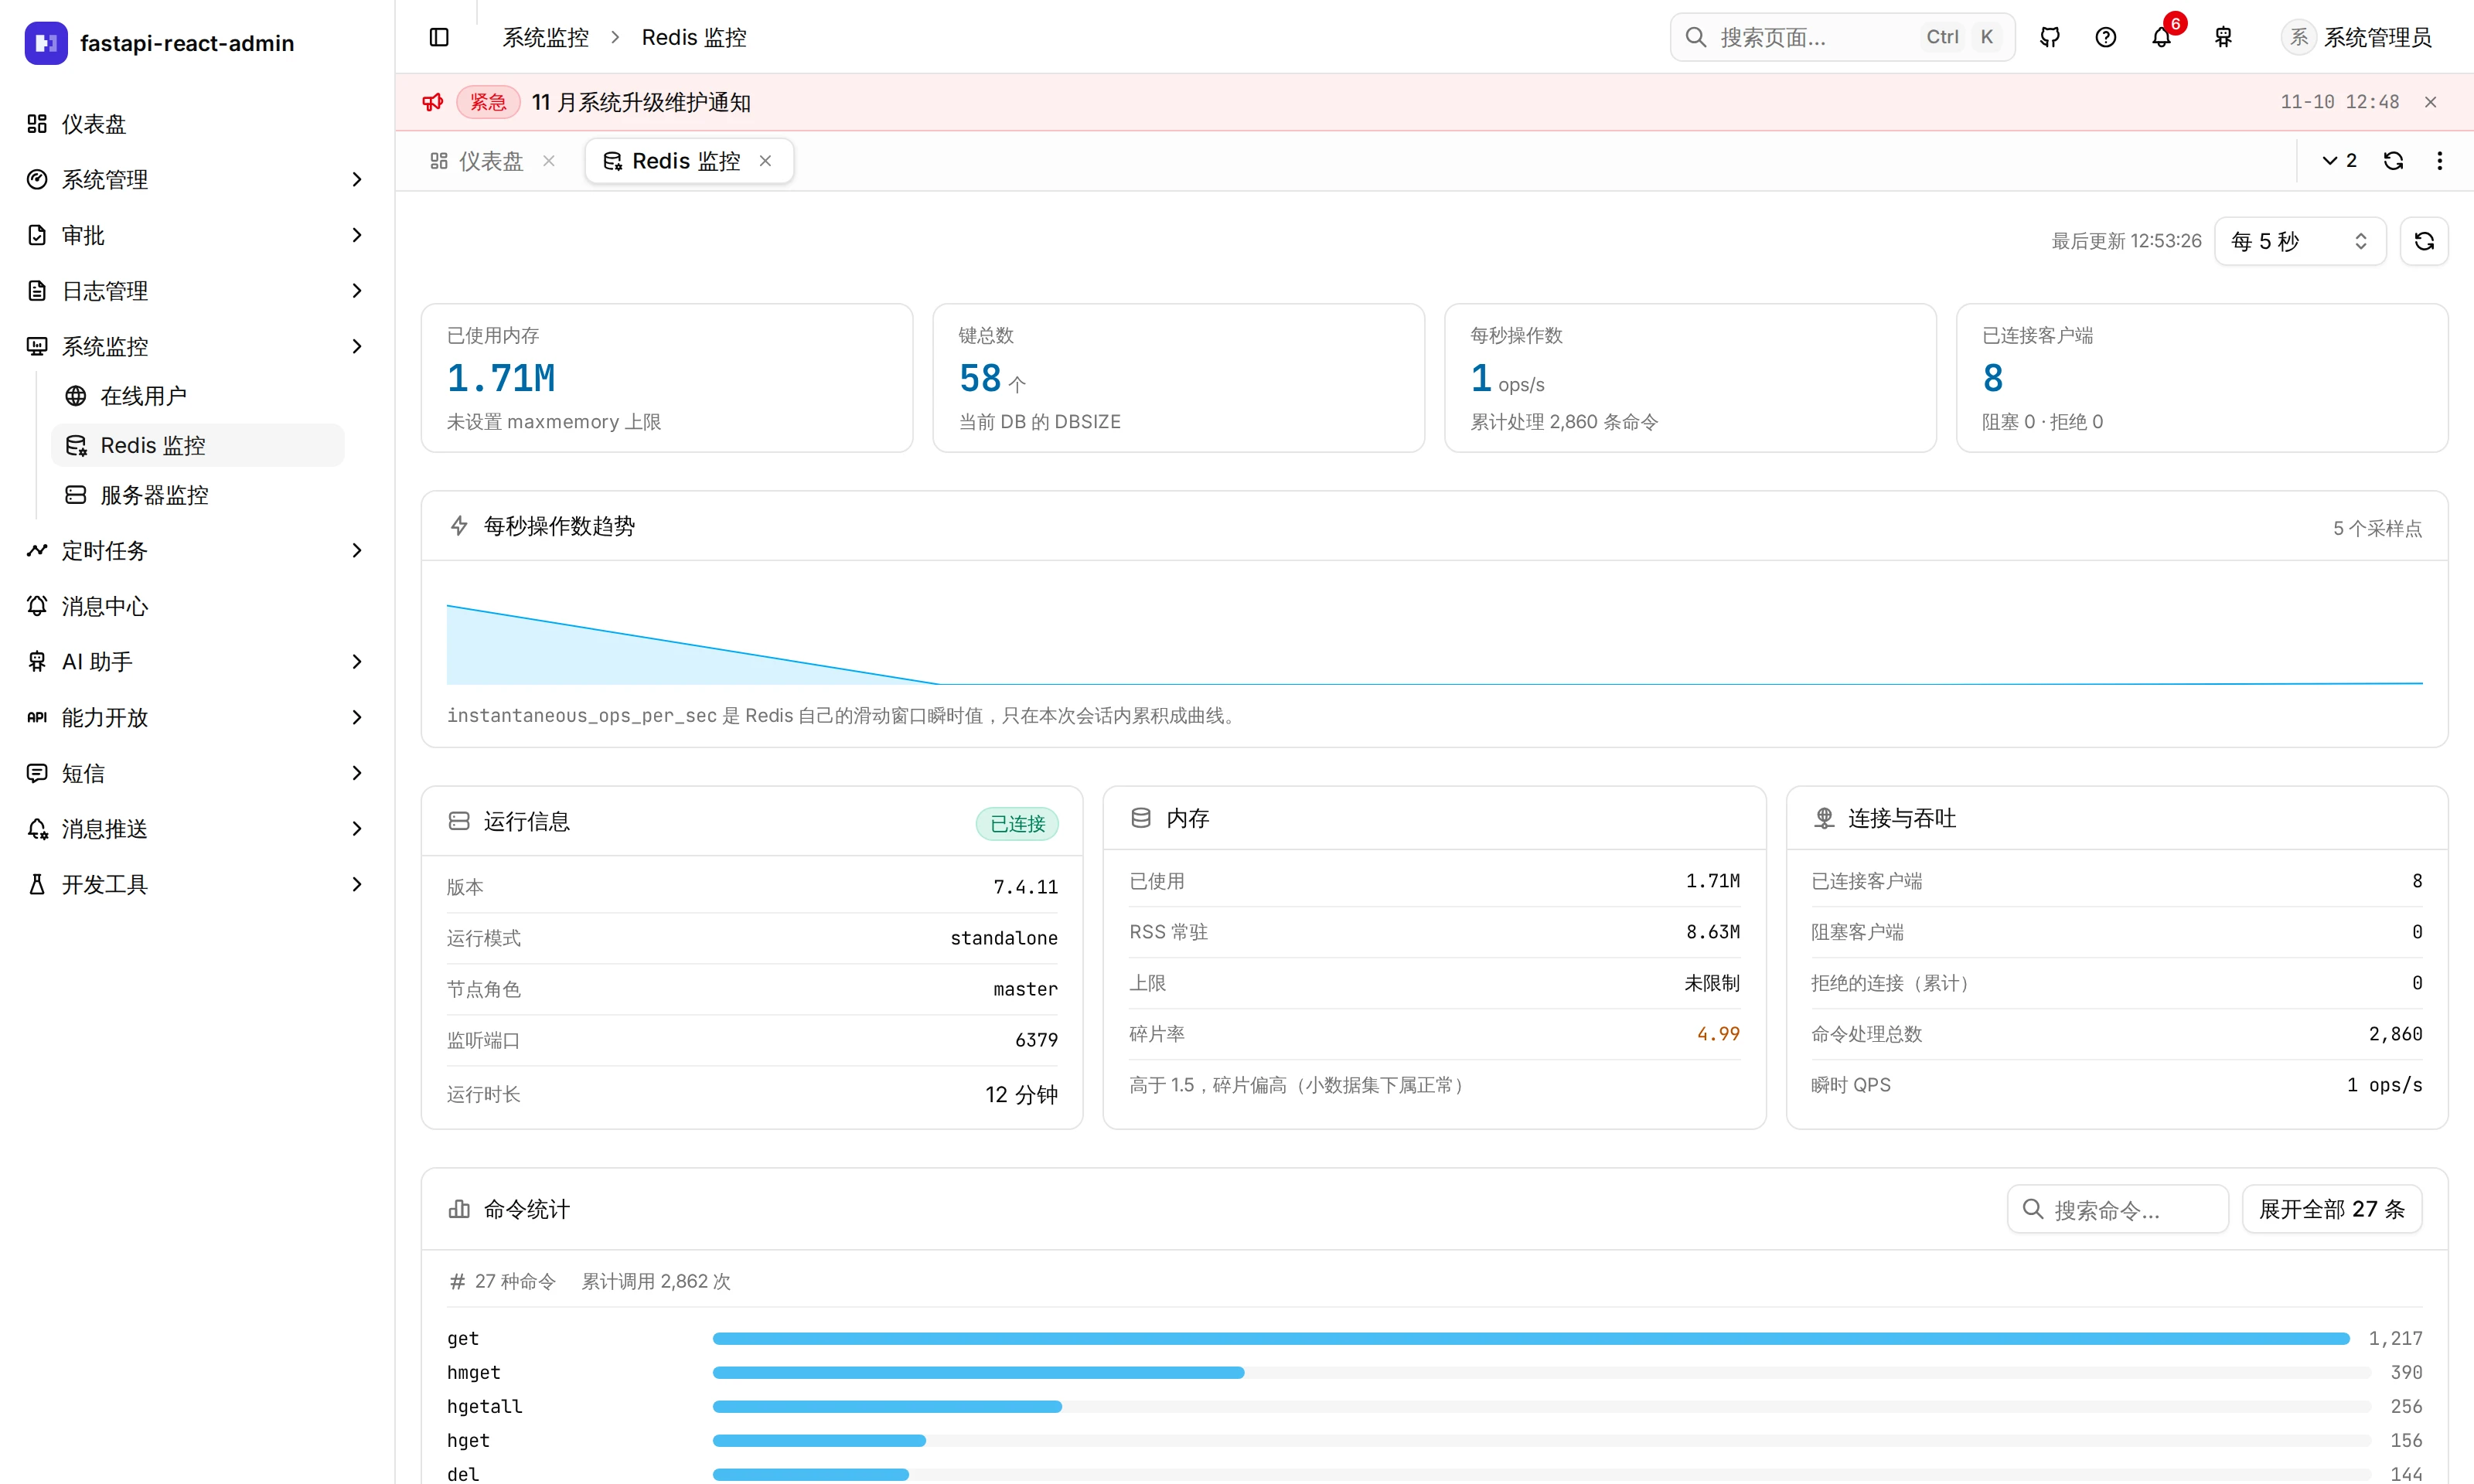
The admin ships two monitoring pages. Server shows the CPU, memory and disks of the machine running the backend, and the backend process itself, right now. Redis shows memory, key count, operations per second, clients and the busiest commands. Both show the present only: the trend lines are the few dozen samples taken since you opened the page, and nothing is stored. External monitoring uses a different address, /api/health/status, which needs no sign-in and reports in one response whether the API, database, Redis, scheduler (beat) and worker are healthy.
Where is it in the UI?
Section titled “Where is it in the UI?”| Screen | Path | Who |
|---|---|---|
| Monitoring → Server | /monitor/server | Superusers |
| Monitoring → Redis | /monitor/redis | Superusers |
| Monitoring → Active sessions | /monitor/online | Superusers; see Session management |
| Dashboard “Service status” card | /dashboard | Superusers |
| Health check | /api/health/status | No sign-in |
Monitoring pages and endpoints are guarded by superuser, with no permission codes: granting these menus to an ordinary role does not let it open them.
What do the two monitoring pages show?
Section titled “What do the two monitoring pages show?”Server:
- Four headline metrics: CPU, memory, the fullest disk, uptime; CPU and memory have trend lines
- CPU cores and frequency; memory total / used / free
- System: hostname, OS, architecture, IP, partition count
- Backend process: Python version, start time, CPU, resident memory, virtual memory, interpreter path
- Disk list (virtual file systems such as
overlayandtmpfsare left out)
Redis:
- Used memory against the limit (
maxmemory), fragmentation ratio (with an explanation) - Key count, for the current database only (
DBSIZE); other databases on the same Redis are not counted - Operations per second and its trend
- Clients: connected, blocked, rejected (rejected is cumulative)
- Version, mode, role, port (as seen inside the container)
- Command stats: the 10 most-called commands, searchable
Refresh: manual, or every 5 / 10 / 30 / 60 seconds, 10 by default, kept in the URL (?refresh=). Polling stops while the tab is in the background and resumes when you come back.
Trend lines keep at most 40 points and vanish when the page closes. These pages answer “how is it right now”; they are not a monitoring system. For history and alerts, use a dedicated system such as Prometheus, Zabbix or your cloud’s monitoring.
What does the health check return?
Section titled “What does the health check return?”GET /api/health/status needs no sign-in, is not rate-limited and is not recorded in the operation log. It checks five things concurrently:
| Item | How |
|---|---|
api | Healthy if it responds |
database | SELECT 1, 5-second timeout |
redis | PING, 3-second timeout |
scheduler | Beat’s scheduling loop writes a heartbeat on every tick (at least one tick a minute, written at most every 15 seconds) |
worker | Beat dispatches a health.heartbeat task every 60 seconds and the worker writes a heartbeat when it runs it |
A heartbeat older than 180 seconds is stale, one never written is missing, and the worker is unknown when Redis cannot be read or the scheduler itself is unhealthy (the worker heartbeat is dispatched by beat, so without beat there is nothing to judge by).
All healthy returns 200; anything else returns 503, with each item’s status and heartbeat age in the body. Errors carry only the exception type name, never its message, so nothing like a connection string leaks to anonymous callers. When the backend is down entirely, nginx returns 503 with {"status":"unavailable"} and Retry-After: 15.
The body ends with version and commit (a 7-character commit hash), so you can tell which release is live; they never affect the 200 / 503 result, and commit is null when no commit was baked into the image. The frontend’s own copy is in /version.json, and after signing in, Help → About in the top bar shows both side by side and flags a mismatch.
Which address external monitoring should probe, and why not /healthz, is in Deploying to a server. Container orchestration uses a separate /health/ready that checks only the database and Redis.
The dashboard’s Service status card reads the same checks, plus how many sessions are online on web, desktop and mobile; it does not poll, and re-opening it within 20 seconds uses the cached result.
Which settings are there?
Section titled “Which settings are there?”All in .env; restart the backend after changing:
| Key | Default | Notes |
|---|---|---|
HEARTBEAT_MAX_AGE_SECONDS | 180 | How old a heartbeat may get before it counts as unhealthy; three cycles by default, so missing one or two ticks (a restart, a deploy) does not alert |
SCHEDULER_HEARTBEAT_REDIS_KEY · WORKER_HEARTBEAT_REDIS_KEY | fba:health:scheduler_heartbeat · fba:health:worker_heartbeat | Redis keys the heartbeats are written to |
The monitoring pages’ refresh interval is chosen on the page and needs no configuration.
What it does not do
Section titled “What it does not do”- Server monitoring describes the machine (or container) running the backend API, not the ones running the database or Redis. The IP is the local address used for an outgoing UDP connection, falling back to
127.0.0.1. - No history, no alerts.
- If beat is stuck while its loop keeps turning, the scheduler heartbeat may still be written and the health check won’t notice.
- The two monitoring pages have no backend or E2E tests; the health check does.
Where is the code?
Section titled “Where is the code?”- Monitoring endpoints:
api/v1/monitor/server.py·redis.py - Health check:
core/registrar.py· scheduler heartbeat intickofapp/task/utils/schedulers.py· worker heartbeat tasktasks/health/· nginx fallbackapps/web/nginx.conf - Frontend:
pages/monitor-server/·pages/monitor-redis/· shared refresh and trends_shared/monitor.tsx· dashboard carddashboard/cards/services.tsx
How is it tested?
Section titled “How is it tested?”security/test_health.py(23 tests): no token needed; a down scheduler makes the workerunknown; worker start-up leaves no connection bound to a throwaway event loop; and more.- E2E covers only the dashboard’s Service status card (five rows plus a summary,
dashboard-personalize.spec.ts).
Try it on the demo
Section titled “Try it on the demo”On the live demo (admin / 123456), open Monitoring → Redis, set refresh to 5 seconds and watch the ops/s trend grow; switch to another tab and back, and there are no samples for the time you were away. Open https://fra.wubunan.com/api/health/status directly in the browser for the health check.